Graphviz - Diagramas y Grafos
Crea diagramas y grafos programáticamente en segundos
Graphviz es un software de visualización de grafos(graphs) de código abierto. La visualización de grafos permite representar información estructural mediante diagramas de grafos y redes abstractos.
Con graphviz puedes programar las descripciones de los grafos (graphs) en un archivo de texto plano, y generar diagramas en SVG, PDF y Postscript, o en formatos interactivos.
En mi caso, he encontrado de utilidad generar pequeñas gráficas para mis presentaciones utilizando graphviz, ya que las puedo modificar y re-generar, sin preocuparme mucho por el formato.
Con la ventaja de que si quiero agregar un nuevo nodo, o si quiero mover un grupo de nodos, simplemente tengo que agregar una línea de código o mover algunas líneas de lugar, o simplemente redireccionar un nodo a otro con una flecha (->). Tal vez podría sonar como demasiado, si la intención es crear solo un diagrama. Pero si los diagramas van a cambiar mucho, o son muy complejos para hacerlos en PowerPoint o algún otro programa, esta es una solución rápida y replicable.
Se tiene un cierto control con la figura de los nodos, los colores, los colores de fondo, etc.
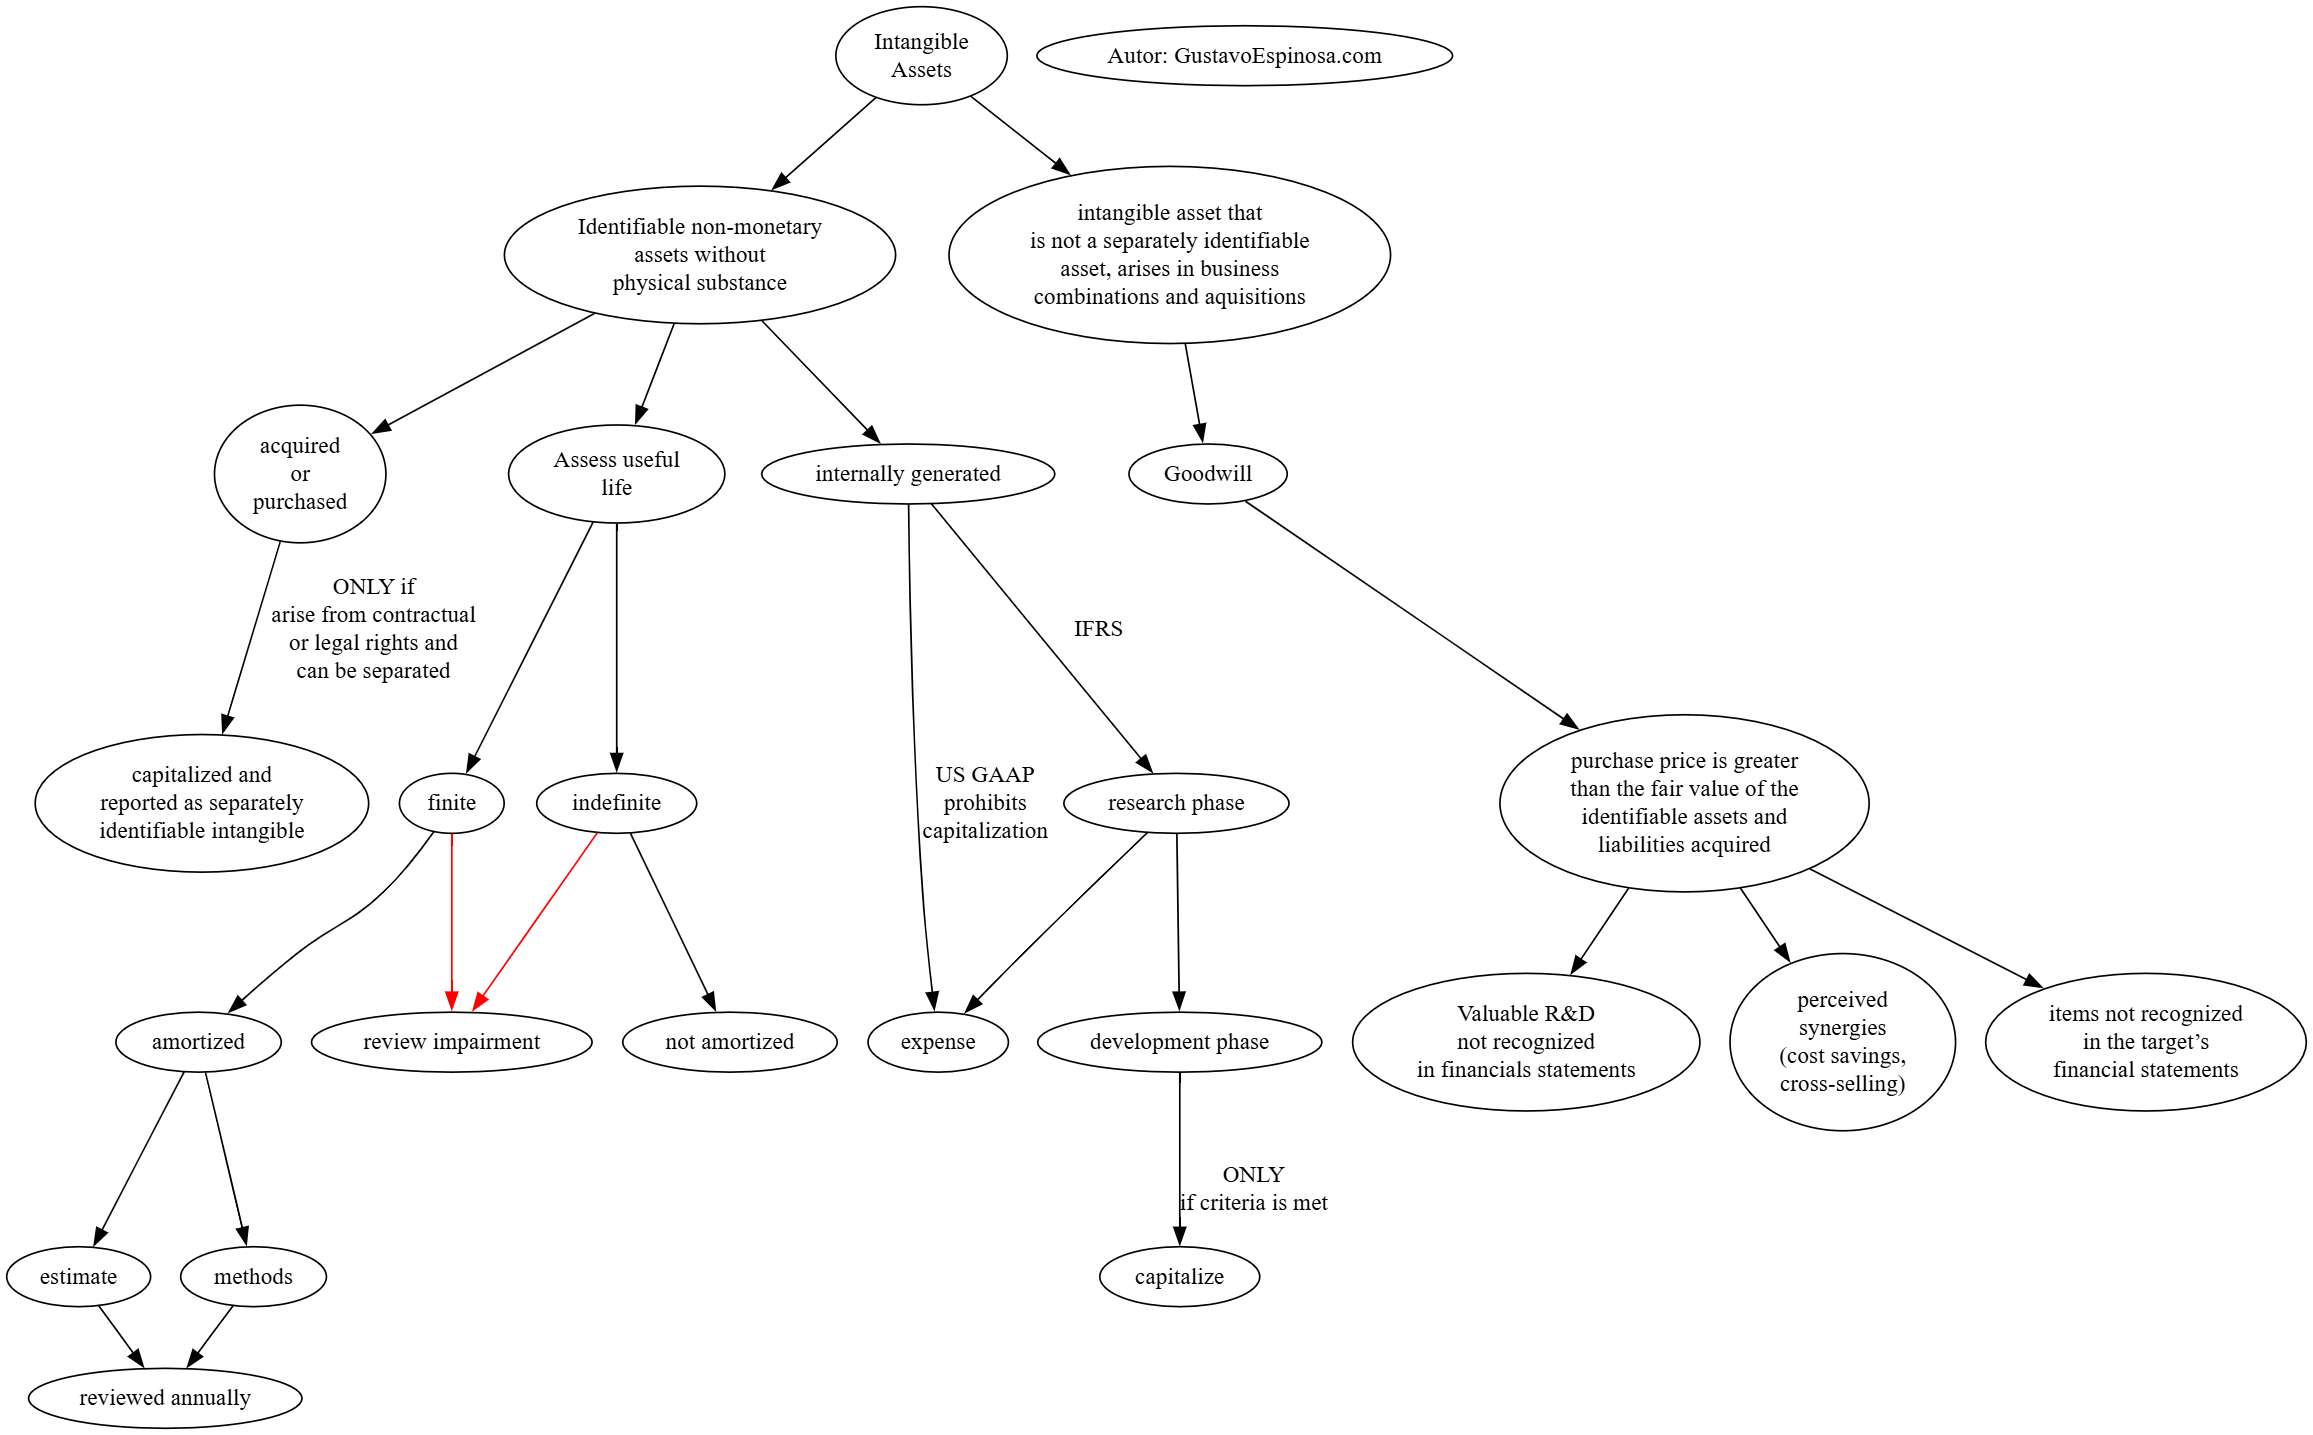
Por ejemplo, este diagrama sobre activos intangibles lo construí a partir del siguiente script en lenguaje DOT:
digraph G {

intangibles [label="Intangible
Assets"]

def [label="Identifiable non-monetary
assets without
physical substance"]

def -> "internally generated"

purchased [label="acquired
or
purchased"]

def -> purchased
treatment [label="capitalized and
reported as separately
identifiable intangible"]

purchased -> treatment [label="ONLY if
arise from contractual
or legal rights and
can be separated"]

"internally generated" -> "research phase" [label = "IFRS"]
"internally generated" -> expense [label = "US GAAP
prohibits
capitalization"]

"research phase" -> expense
"research phase" -> "development phase"

"development phase" -> capitalize [label="ONLY
if criteria is met"]

intangibles -> defgood


defgood [label="intangible asset that
is not a separately identifiable
asset, arises in business
combinations and aquisitions"]


defgood -> Goodwill

calcgood [label="purchase price is greater
than the fair value of the
identifiable assets and
liabilities acquired"]

Goodwill -> calcgood

calcgood -> item1
calcgood -> item2
calcgood -> item3

item1 [label = "items not recognized
in the target’s
financial statements"]
item2 [label = "Valuable R&D
not recognized
in financials statements"]
item3 [label = " perceived
synergies
(cost savings,
cross-selling)"]


life [label="Assess useful
life"]

intangibles -> def

def -> life

life -> finite
life -> indefinite

finite -> amortized
indefinite -> "not amortized"

amortized -> estimate

amortized -> methods

estimate -> "reviewed annually"
methods -> "reviewed annually"

finite -> "review impairment" [color=red]
indefinite -> "review impairment" [color=red]

"Autor: GustavoEspinosa.com"
}
Puedes probarlo en https://dreampuf.github.io/GraphvizOnline o descargar el programa de https://graphviz.org/ para generar diagramas offline.
I am learning how to program these charts using Graphviz. The idea is that charts are created with code (called “dot” language) and you can generate them instantly, with some (limited) control in color, shapes, etc. Changing and adding nodes and relationships is very easy. So far, i think is overkill but, if i need to make changes or updates overtime, or have different versions of the chart, I can save time if I just change one line of code and re-generate it. I don’t have to worry about moving lines, repositioning or arranging nodes, so it is fast and practical.
